After every 210,000 blocks mined, or roughly every four years, the block reward given to Bitcoin miners for processing transactions is cut in half. This cuts in half the rate at which new Bitcoin is released into circulation. This is Bitcoin's way of using a synthetic form of inflation that halves every four years until all Bitcoin is released and is in circulation.
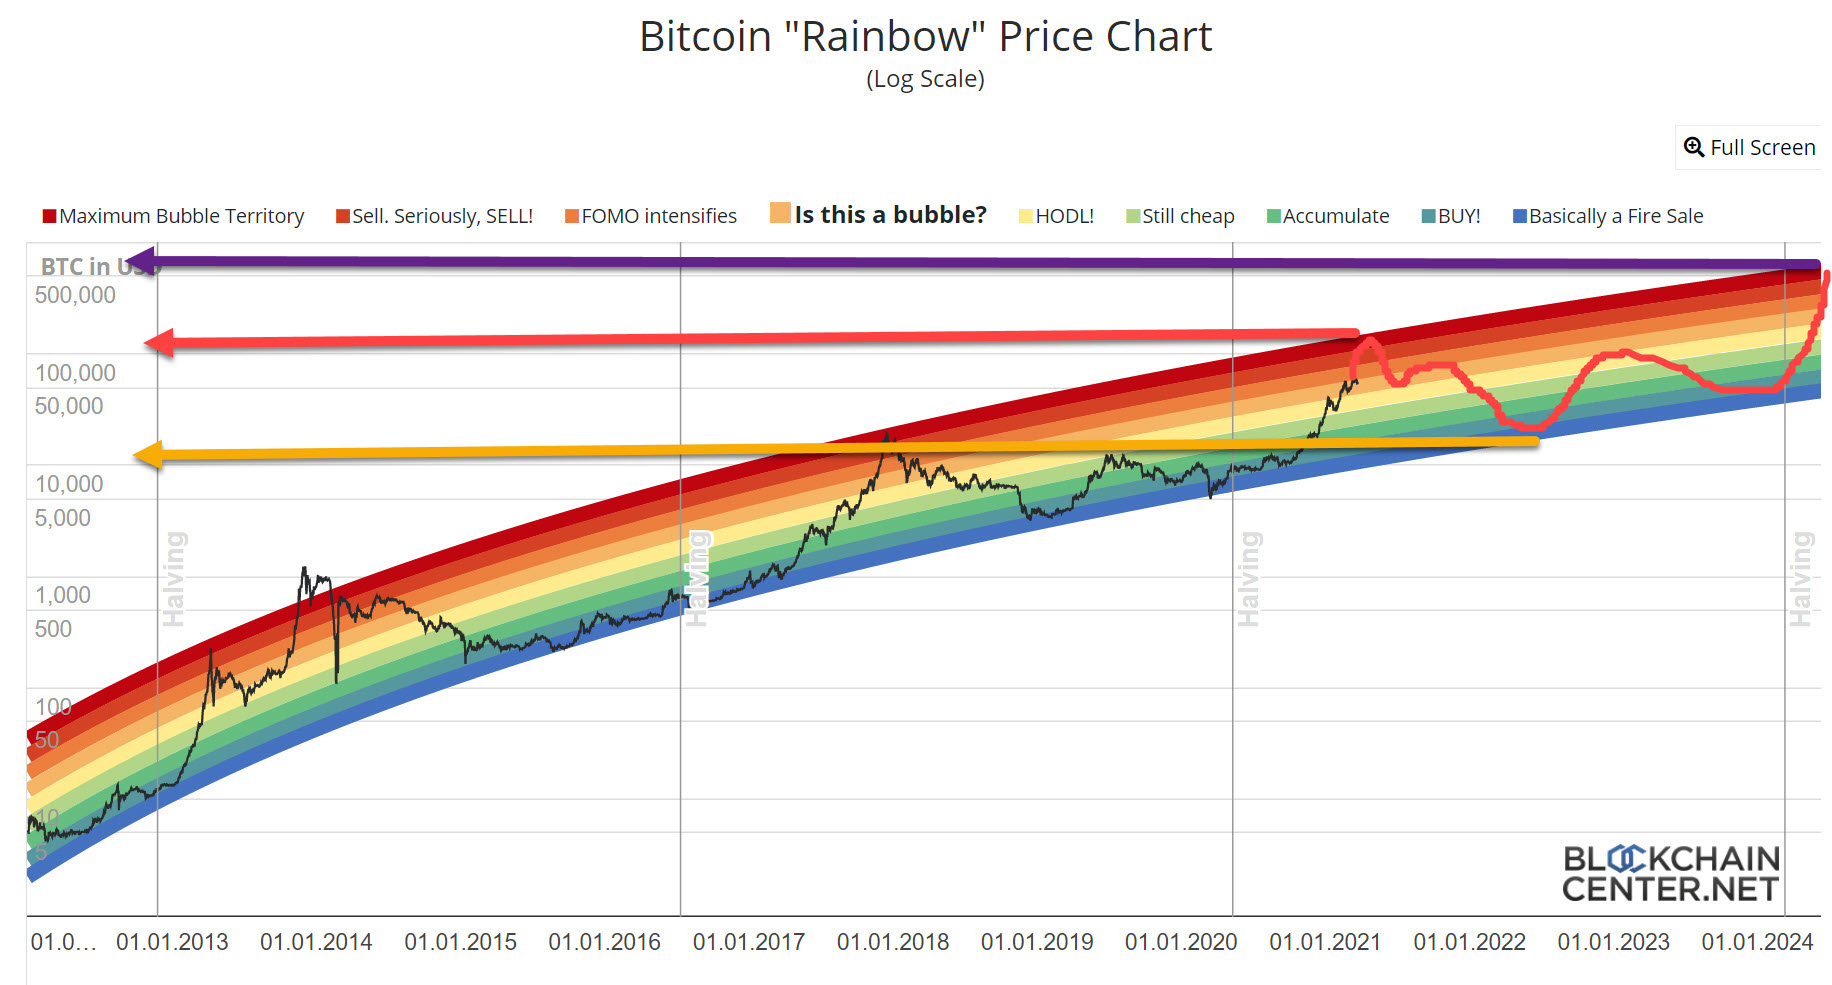
The chart above shows four vertical lines indicating each of the halvenings since 2013. Many try to correlate a surge in price to a few weeks or months after each halvening.
Note that each color of the rainbow represents the following categories:
- Firesale
- Buy
- Accumulate
- Still cheap
- HODL (HODL = Hold On for Dear Life)
- Is this a bubble?
- FOMO Intensifies (FOMO = Fear of Missing Out)
- Sell! Seriously Sell!
- Maximum Bubble Territory (get out before it drops)
Now, I cannot predict the future. But I can guestimate what might happen if the trend continues. I drew a red curve showing what BitCoin could possibly do, and then I added some arrows to show potential prices. If this chart hold, then any future prices should be within the rainbow pattern. If that happens, and I’m not saying it will, then BitCoin could go over $100,000 and then again to the range between probably $20,000 and $35,000. It could then surge on up to over $500,000 or more. Since there are not more specific and smaller tick marks on the X axis, it’s a little hard to pick a price on the logarithmic scale.
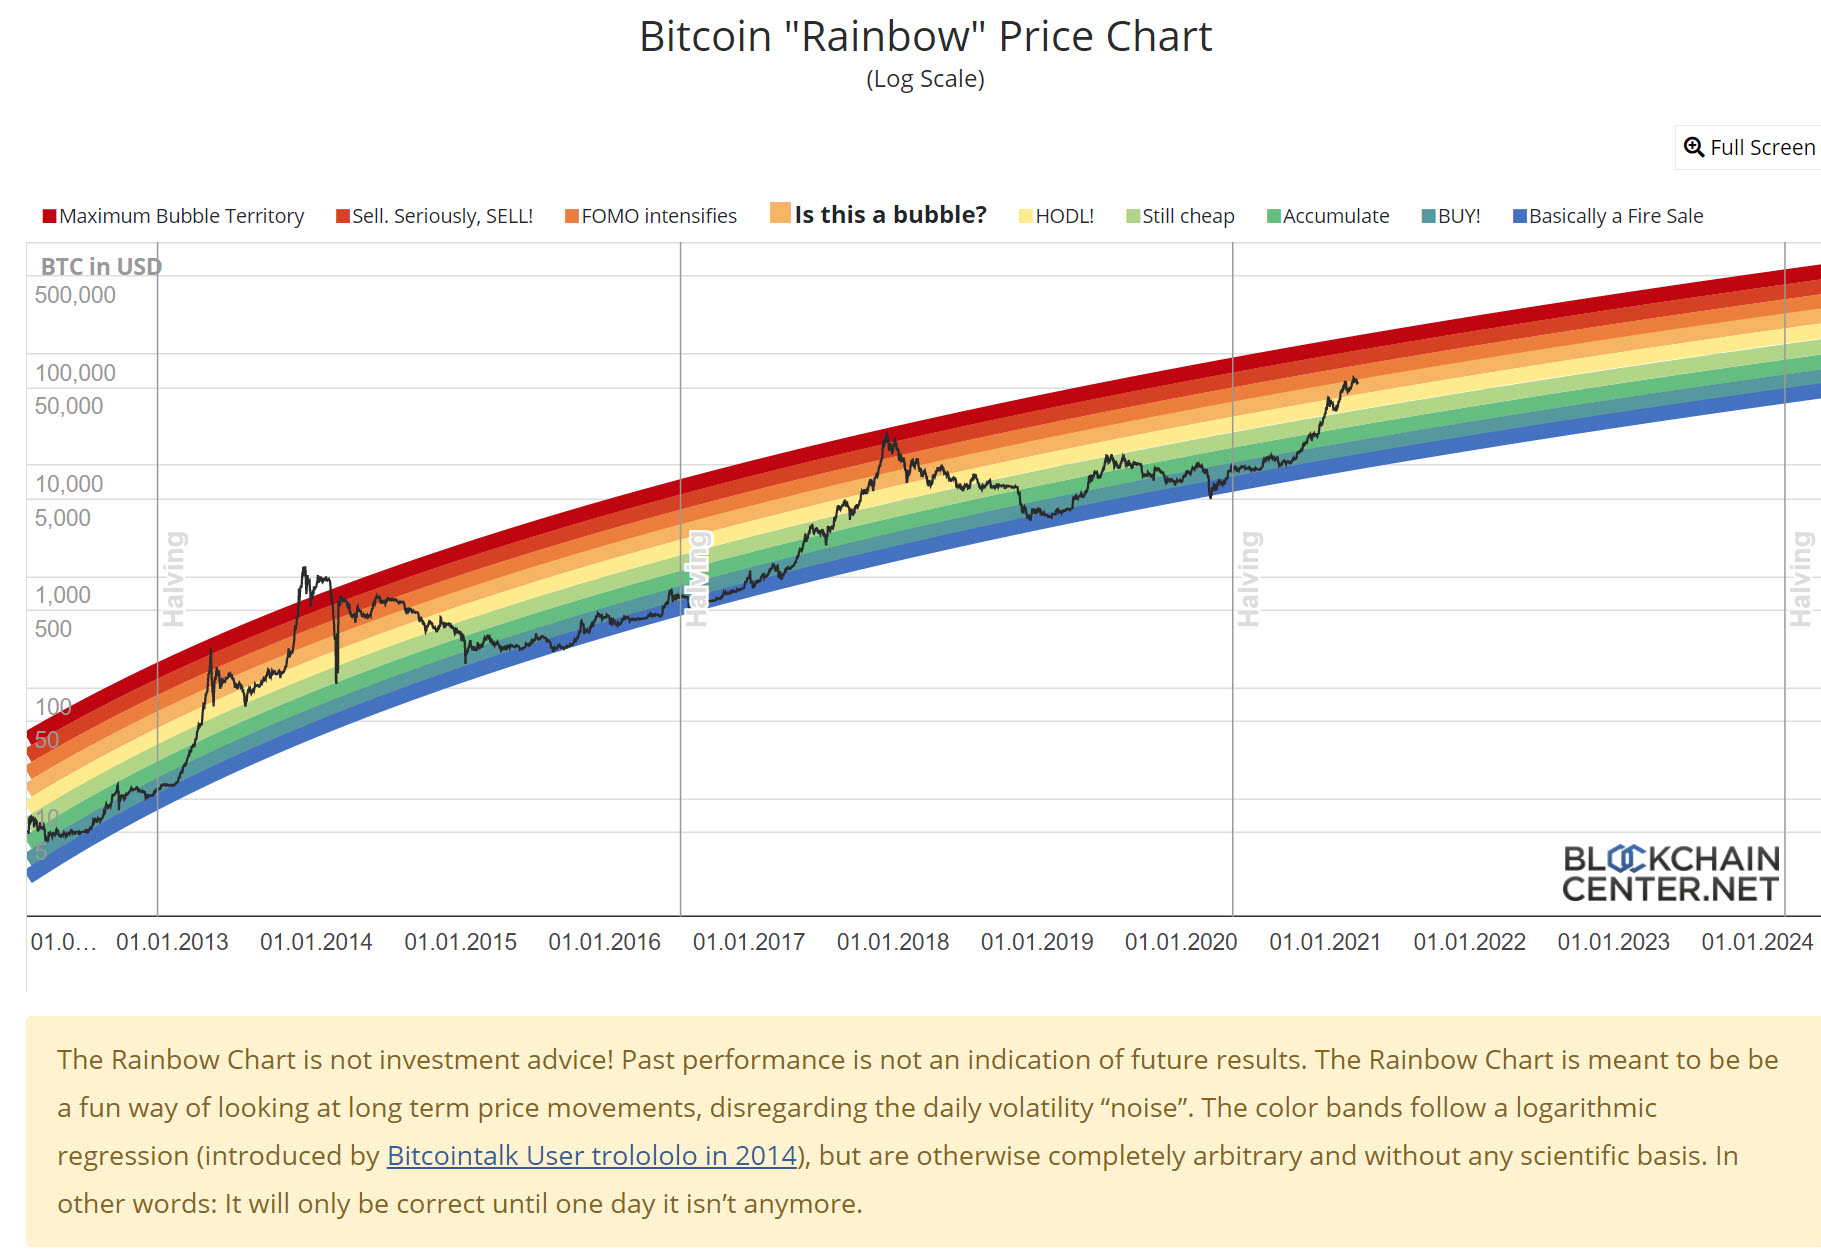
There are many other models for the future price of BitCoin, but I just wanted to show you this simple one. It does show the volatility, i.e. the wide swings that cryptocurrencies have.
It is very hard to pick the exact top or bottom. I’m a member of Marius Landman’s BitTrend and Forecast, available via “ToNoIt”. Marius provides weekly webinars on the status of BitCoin, Ethereum, and even gold, silver, and the stock market, along with dozens of other cryptos. he has done an excellent job of picking many of the tops and bottoms of the past.